Every few weeks a new model “takes the top spot” on a leaderboard, and the claim travels faster than any explanation of what the leaderboard measures. A leaderboard is not one thing. Some rank models by what thousands of people vote for in blind comparisons, some by automatic scores on fixed question sets, and some by speed and price measured on live services. Each style answers a different question and breaks in a different way. This guide explains how the main kinds work, how an arena turns votes into a rating, and what researchers have found when they audited the system.
For a fast checklist on a single announcement, see our cheat sheet on reading a benchmark claim. For the fundamentals of why fixed tests lose usefulness over time, read how AI benchmarks work and why they saturate. This piece covers the leaderboard layer on top of them.
Three kinds of leaderboard
Preference arenas. Chatbot Arena, described in a 2024 paper by researchers from UC Berkeley and collaborators, shows a visitor two anonymous model answers to the same prompt and asks which is better. The authors describe a pairwise comparison approach fed by crowdsourced votes, and reported over 240,000 votes at the time of writing. They also report that the crowdsourced questions were diverse and discriminating and that the votes agreed well with expert raters. The strength is that the prompts come from real users, so the test is hard to memorize.
Fixed-task benchmarks. These score answers automatically against a known right answer: multiple-choice knowledge, math problems, code that must pass tests. They are cheap to rerun and easy to compare, but once a test set is public, it can leak into training data.
Operational leaderboards. Services such as Artificial Analysis combine intelligence indexes with performance and price measurements. Its methodology page says its performance benchmarking measures the end-to-end performance customers experience across inference providers, rather than the maximum possible on any hardware. That answers a buyer’s question, how fast and how costly is this endpoint, that quality scores ignore.
How votes become a rating
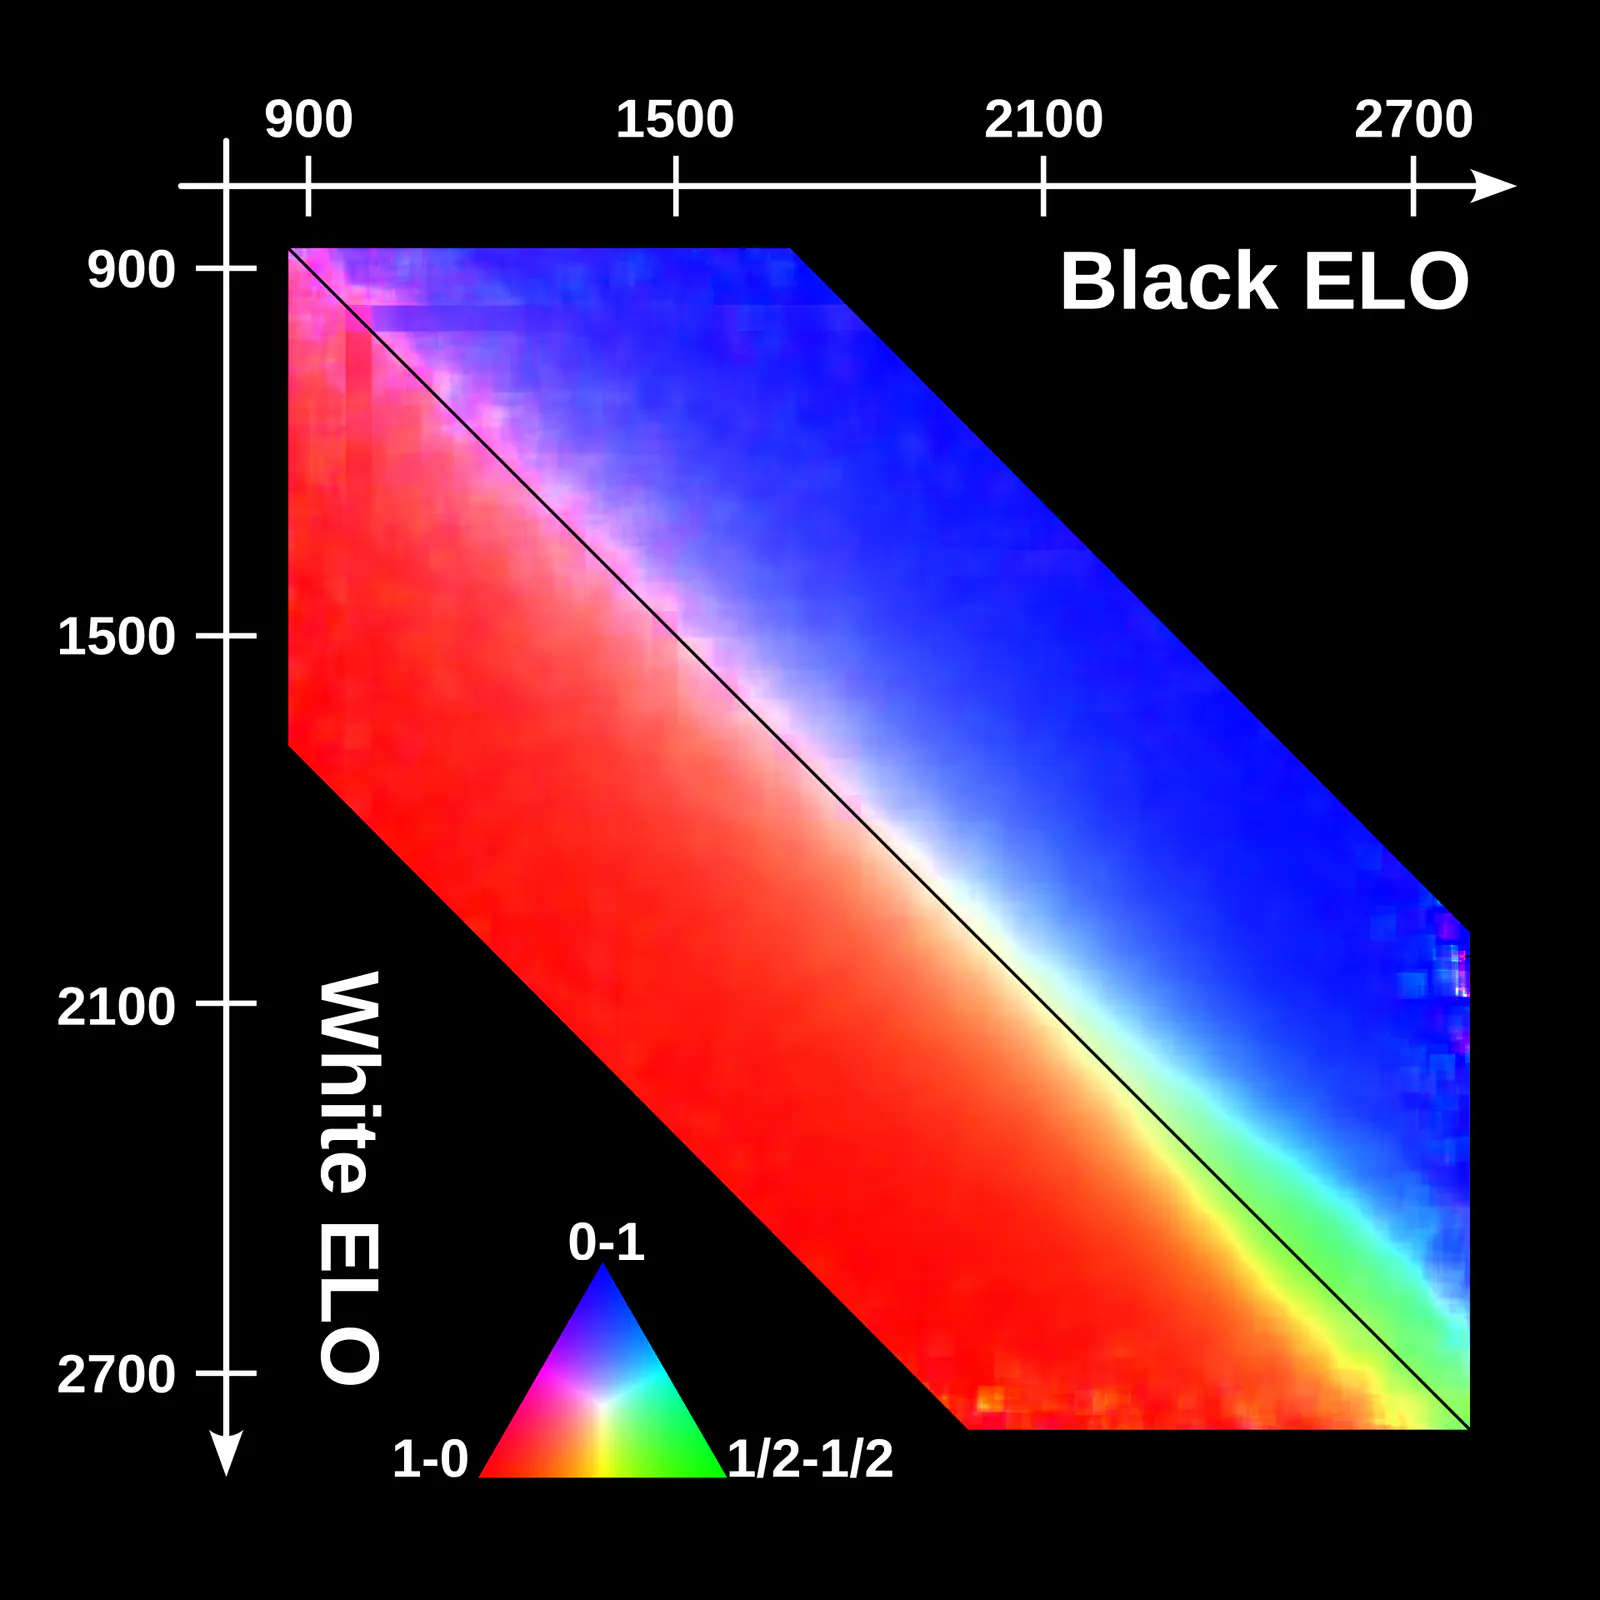
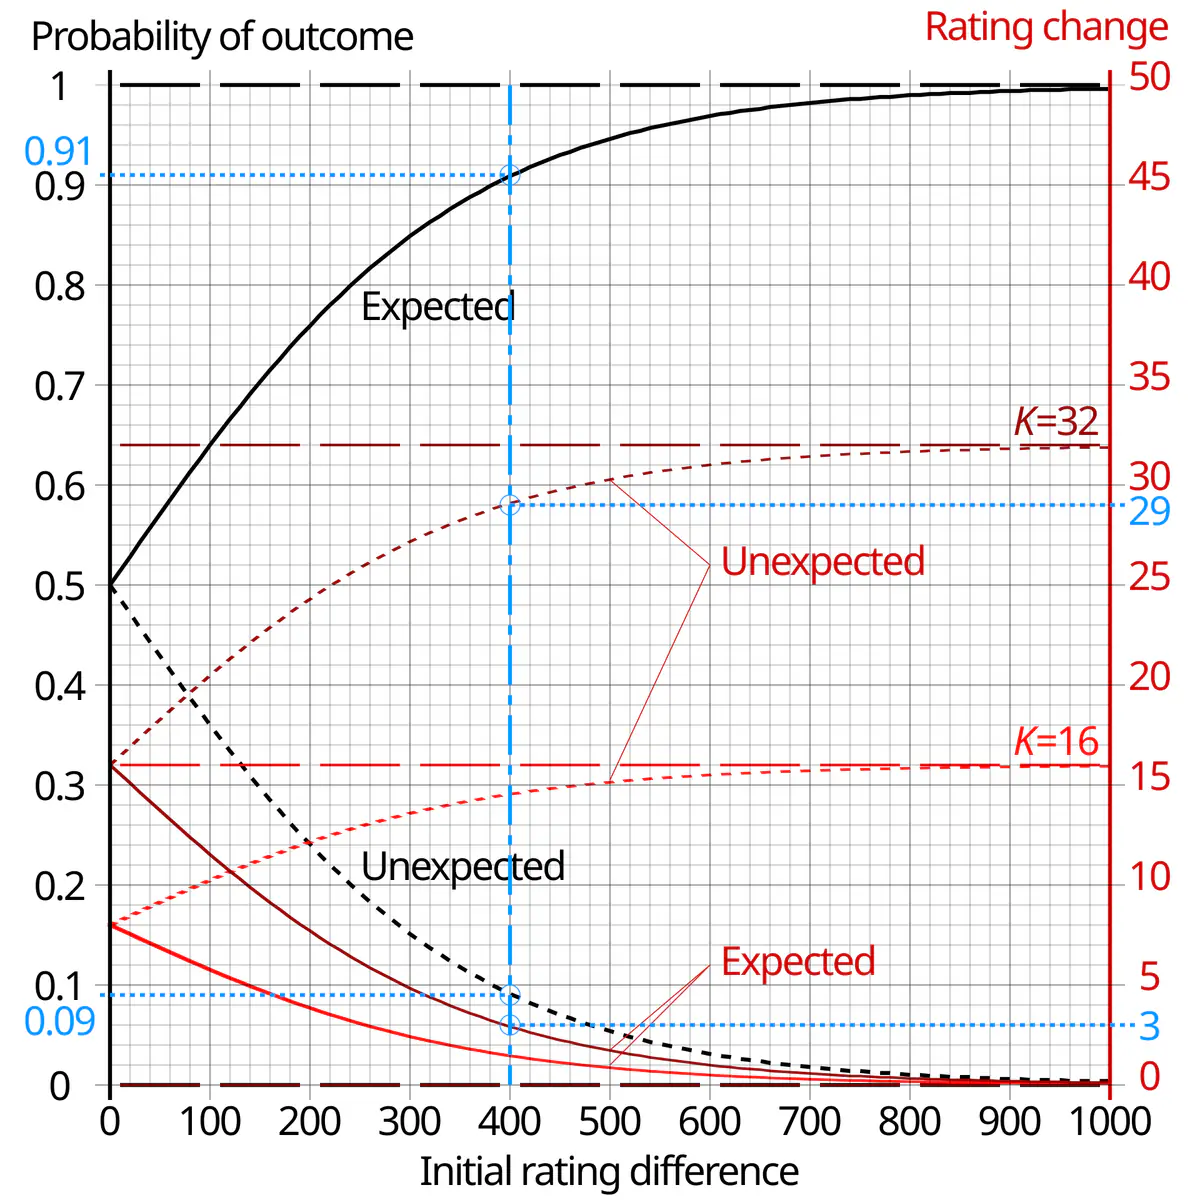
An arena needs a way to turn many two-way votes into one ranked list. The standard approach treats each vote as a match between two players. If a model that is expected to win does so, its rating moves a little; an upset moves it more. The Chatbot Arena paper explains the statistical methods used for efficient and accurate ranking, and presents confidence intervals rather than a single exact position. This matters when reading the table: two models a few points apart are often statistically tied, and a ranking that shows them as first and second is exaggerating the gap.
Several choices shape the result:
- Who votes and what they ask. Voters are self-selected visitors, and their prompts skew toward certain topics and languages.
- What wins a vote. A longer, more confident or better-formatted answer can beat a more accurate one. Many arenas now publish style-adjusted views to separate formatting from substance, but a raw preference score is still a measure of preference.
- How many battles each model gets. More votes mean tighter intervals. A model with few votes has a noisy rating.
Contamination: when the test is in the textbook
Fixed benchmarks face a different problem. Researchers led by Oscar Sainz argued in a 2023 position paper that classical evaluation on annotated benchmarks is in trouble because a model trained on the test split of a benchmark and then evaluated on it will look better than a clean counterpart. They noted that the extent of the problem is unknown because it is hard to measure, and called for per-benchmark contamination measures. The effect is not always deliberate; benchmark questions and answers get copied across the web, and a large scrape picks them up.
One response is to use questions that did not exist when a model was trained. The LiveBench paper describes a benchmark with frequently updated questions drawn from recent math competitions, arXiv papers, news and datasets, scored automatically against objective ground truth. Its authors designed it to be resistant to both contamination and the biases of judging by humans or by other models. The trade-off is maintenance: a living benchmark has to keep producing new, equally hard questions, and results from different months are not strictly comparable.
What the audit of an arena found
In 2025 a team led by Shivalika Singh published “The Leaderboard Illusion,” an analysis of Chatbot Arena. Their abstract reports several findings:
- Undisclosed private testing lets a handful of providers test multiple variants before public release and retract scores, so the choice of the best score biases results through selective disclosure. They identified 27 private variants tested by Meta ahead of the Llama 4 release.
- Proprietary closed models are sampled at higher rates and removed less often than open-weight alternatives, creating a data-access asymmetry. They estimated that Google and OpenAI received about 19.2% and 20.4% of all arena data, while 83 open-weight models combined received about 29.7%.
- Access to arena data can help a model be tuned to the arena’s style.
These are the authors’ findings from their analysis, and the arena’s operators have their own account. The lesson does not depend on who is right in detail: any leaderboard that lets participants submit privately, choose what to publish, or receive more data is open to gaming without anyone cheating on the test itself.
A practical way to read a ranking
- Find the question. Preference, accuracy on fixed tasks, or price and speed?
- Check the interval. If the gap is smaller than the margin of error, call it a tie.
- Check the date and version. Was the tested model the one you can actually use, or a variant that was never released?
- Look for contamination defenses. Does the benchmark use fresh questions or hidden test sets? The BetterBench study of 24 benchmarks found large quality differences and that most did not report statistical significance or allow easy replication.
- Cross-check across boards. A model that leads one list and sits mid-table on another is telling you something about the task.
- Test on your own tasks. Twenty real examples from your work beat any aggregate.
What to watch next
- Whether arena operators publish fuller disclosure of private testing and sampling rates.
- More benchmarks that refresh questions on a fixed schedule.
- Wider adoption of significance reporting and replication kits, as BetterBench recommends.
- Operational leaderboards that include cost per solved task, not just per token.
Key takeaways
- A leaderboard’s type tells you what it measures: preference, task accuracy, or price and speed.
- Arena ratings are statistical estimates with intervals; small gaps are noise.
- Contamination inflates scores on public fixed tests; fresh-question benchmarks reduce but do not eliminate the problem.
- Researchers have reported that selective disclosure and uneven data access can bias an arena.
- Always validate a ranking against your own tasks.
Frequently asked questions
Is an arena ranking the same as accuracy?
No. It measures which answer voters preferred, which can reflect style and length as well as correctness.
What is data contamination?
It is when a benchmark’s test questions or answers appear in a model’s training data, which can make scores look better than the model’s real ability.
Can a leaderboard be trusted at all?
Yes, with limits. Use it as a shortlist tool, read the method and interval, and confirm with your own tests.