A traditional web service either works or throws an error. An LLM feature can return a perfectly formatted answer that is wrong, slow, expensive or unsafe — and nothing in standard monitoring will notice. Observability for AI applications means recording enough about each interaction to understand quality, cost and behaviour over time.
What to log for every model call
- Request metadata: timestamp, feature or endpoint, user or tenant id (pseudonymized where possible), model name and version.
- Inputs: the prompt template version and the variables filled in; retrieved documents and their ids for RAG.
- Outputs: the response, finish reason (completed, length limit, content filter), and structured output validation results.
- Usage: input and output tokens, cached tokens, cost estimate.
- Timing: time to first token and total latency.
- Tool calls: which tools an agent called, with arguments and results.
- Errors and retries: rate limits, timeouts, invalid outputs.
The OpenTelemetry project publishes semantic conventions for generative AI — standard attribute names for model, token usage and operations — so traces from different libraries and vendors can be analysed together.
Tracing multi-step workflows
RAG pipelines and agents involve many steps: query rewriting, retrieval, reranking, several model calls, tool executions. A trace links all of them under one request, showing where time and tokens went and which step went wrong. Without traces, debugging an agent that “sometimes gives weird answers” is guesswork.
Metrics worth watching
Operational: latency percentiles (p50, p95), error and retry rates, rate-limit hits, tokens and cost per request and per user.
Quality signals:
- explicit feedback (thumbs up/down, corrections);
- implicit feedback (user rephrases the same question, abandons, copies the answer);
- validation failures for structured outputs;
- refusal rates;
- retrieval hit rates (did the answer cite the retrieved documents?).
Safety signals: flagged content, prompt-injection attempts, personal data detected in inputs or outputs.
Turning logs into quality
- Review samples weekly. Read a random sample of real conversations plus all flagged ones.
- Grow your evaluation set from real failures — see how to build an evaluation set.
- Score automatically where possible, for example with an LLM-as-a-judge calibrated against human ratings.
- Compare versions. Tag every request with prompt and model versions so you can see whether a change helped.
- Alert on shifts: sudden rises in cost per request, latency, refusals or negative feedback.
Privacy and retention
Prompts often contain personal or confidential data. Minimize what you store, redact sensitive fields, restrict access, set retention periods and document it in your privacy notice. Frameworks such as the NIST AI Risk Management Framework emphasize monitoring as part of managing AI risk.
Build or buy
Open-source and commercial LLM observability platforms provide tracing, dashboards, evaluation and prompt management. Small teams can start by sending structured logs to their existing logging stack with OpenTelemetry attributes, then adopt a dedicated tool as volume grows.
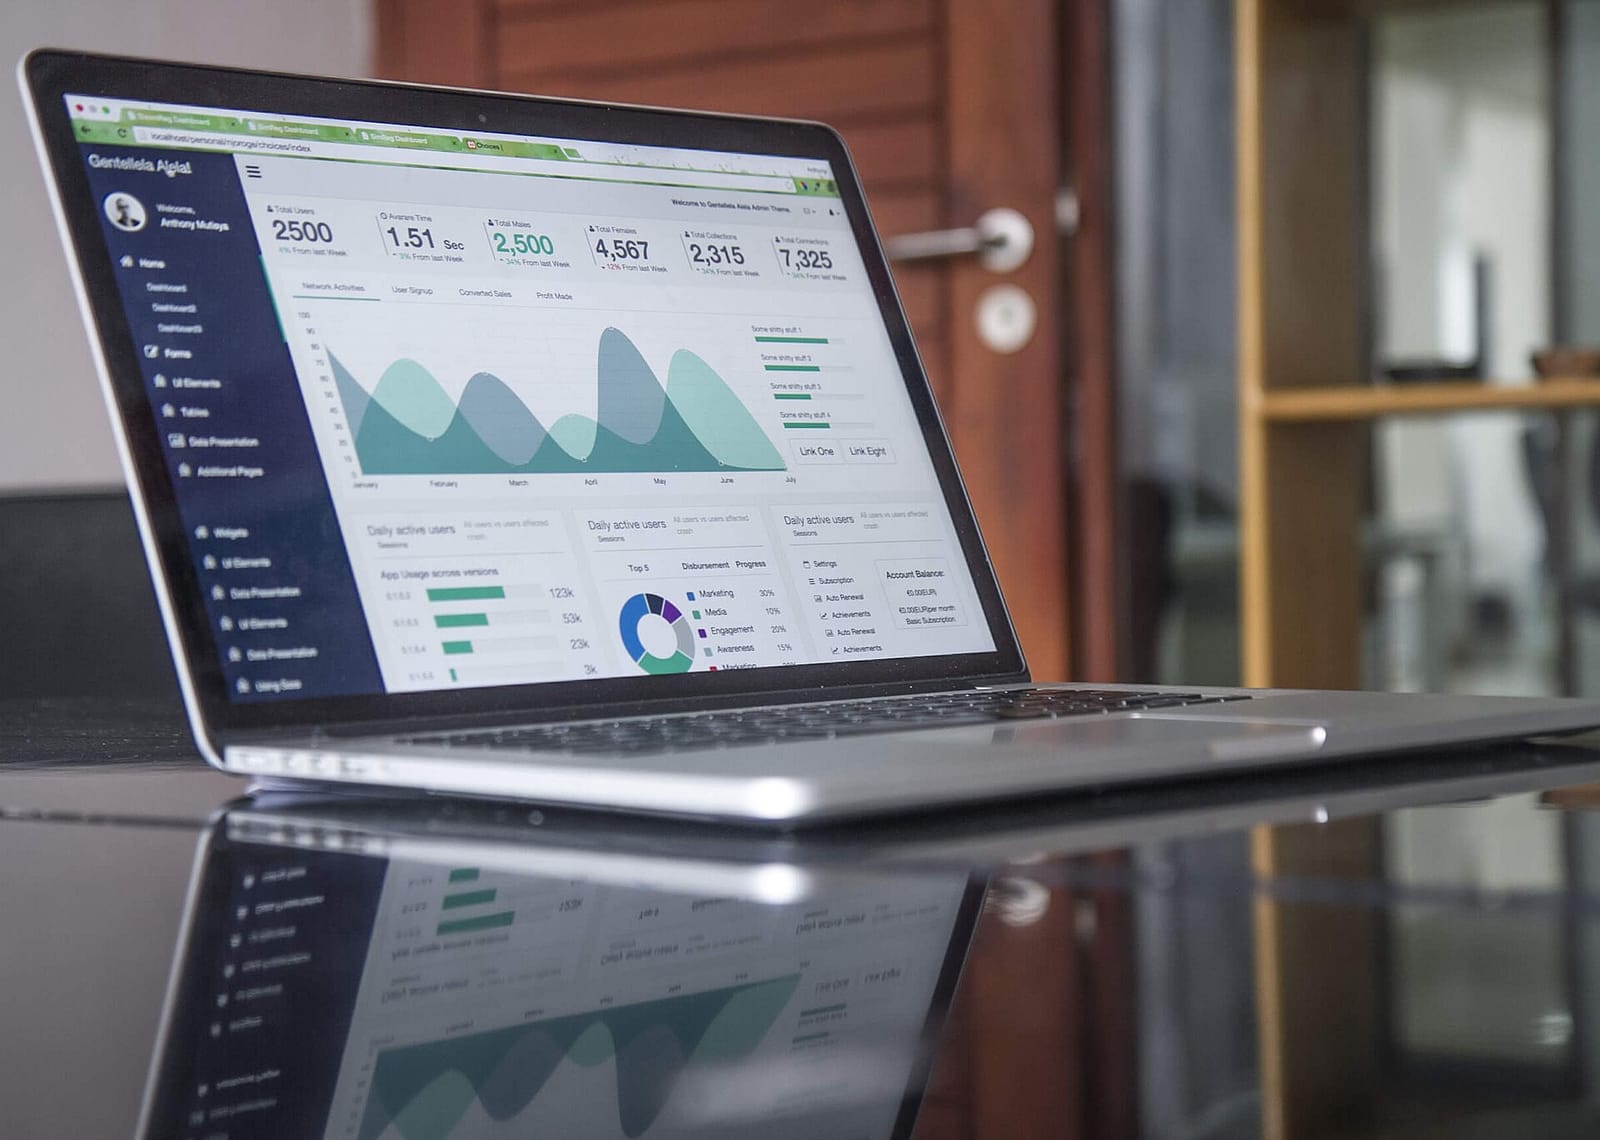
A starter dashboard
If you only build one dashboard, include:
- Requests per minute and error rate by error type.
- Latency p50 and p95, including time to first token.
- Tokens and cost per request, per feature and per day.
- Share of responses with negative feedback or user rephrasing.
- Structured-output validation failures.
- Top retrieved documents and how often answers cite them.
Review it weekly with someone who also reads sample conversations: numbers show where to look, transcripts show what is actually wrong.
What to watch next
- Wider adoption of OpenTelemetry conventions for generative AI.
- Built-in evaluation and tracing in model provider platforms.
- Monitoring standards for autonomous agents and tool use.
- Regulatory expectations for logging high-risk AI systems.
Key takeaways
- LLM features can fail silently, so standard monitoring is not enough.
- Log model, prompt version, inputs, outputs, tokens, latency and tool calls.
- Traces link the steps of RAG pipelines and agents for debugging.
- Combine operational, quality and safety metrics with regular sample reviews.
- Minimize and protect stored prompts that may contain personal data.
Frequently asked questions
What is the difference between evaluation and observability?
Evaluation tests a system against known cases before release; observability watches real usage in production. Both feed each other.
Should I log full prompts and responses?
Log what you need to debug and improve quality, redact sensitive data and set retention limits.
Do I need a special tool?
Not to start. Structured logs and traces in your existing stack work; dedicated tools help at larger scale.